Agenda: We will be using ASP.NET as our framework and Visual Studio Code as our Code editor.
- Installing Visual Studio code
- Installing .NET Core SDK and Runtime
- Configuring Visual Studio Code for C# application and installing appropriate and useful extensions
- Creating ASP.net development services
- Running and Debugging above created console application
Step 1: Navigate to https://code.visualstudio.com and download, and install Visual Studio Code. Highlighted below.

Please select the appropriate Version of Visual Studio according to your machine configurations, and an installer will be downloaded on your machine. Once downloaded, right-click on it and select "Run as Administrator", and follow the onscreen instruction until the installation gets finished.
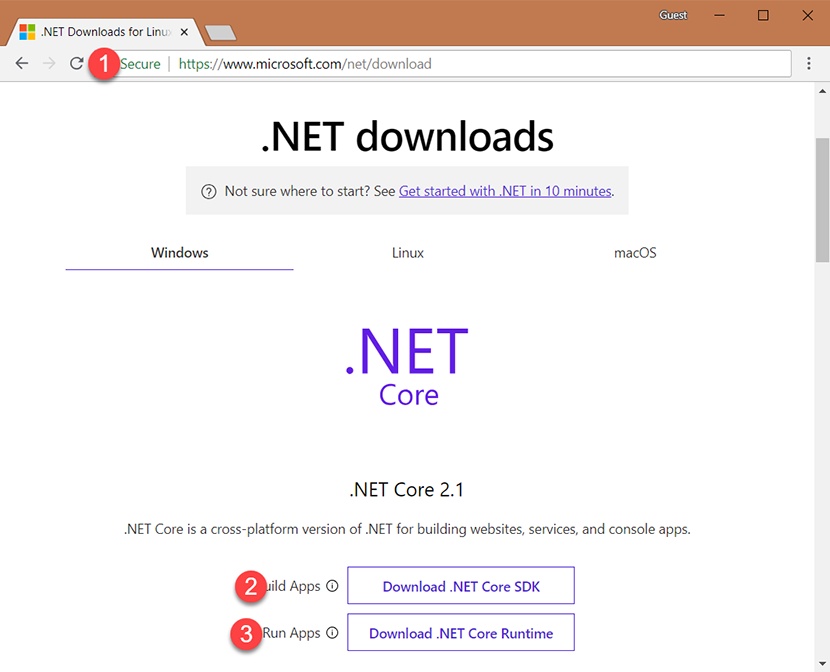
Step 2: Navigate to https://www.microsoft.com/net/download and download asp.net core SDK and runtime on your machine.

Once you download the above two files, follow the same installer steps I mentioned in Step 1.
Step 3: Now, we need a folder where we will create our project. So, create a new folder anywhere you want. For example, I am creating a folder on the Desktop of the machine.

Step 4: Open the folder, and in the Address bar of the Windows Explorer, type cmd to open a command prompt on that folder location.

Step 5: Once you press Enter on your keyboard, the command prompt will open. Please verify whether the path is correct or not.

Step 6: As we are about to use Visual Studio Code as our code editor, we need to open this newly created folder in Visual Studio Code. So, the easiest way is to type ‘Code .’ in the above command prompt window. It will automatically open Visual studio code with this folder.


Step 7: Since we want to create a C# console application and want to activate debugging feature in Visual Studio code, we need to install a C# extension provided by Microsoft for us.
Press Ctrl + Shift + P together, and a command window will open in Visual Studio Code. Type the below-mentioned command and select ‘Install Extensions’ to open Extensions Gallery.

Step 8: Once the gallery is open, type C# in the search bar and install the below-mentioned extension in the Visual Studio Code editor.

Once it gets installed, we need to click the ‘Reload’ button, shown below, to make the extension activate.

And we have done with the configuration. Now, let’s create our Console application.
Step 9: You can see that there are five big icons on the left. The topmost is to open the folder where our code resides. Click on that and follow the below steps to open the Integrated terminal.

Step 10: Integrated terminal is the best feature of Visual Studio Code which is why it is the most dominant code editor in the market. So, Type ‘dotnet new console’ in the terminal window, and it will install the necessary template files required for a console application.

If you notice in the above screenshot, a .csproj, Program.cs file, and Program.cs file is created.
- .csproj file is used when we need to open this project Visual Studio IDE.
- Program.cs is our main file which contains the Main method, which is the entry point of our project.
- Obj folder contains some of the necessary DLLs.
Congratulations, we have created our Console application with ASP.NET Core. Let’s make some changes in the code and use the debugging feature.
Step 11: Click on Program.cs file and make the below changes to the Main method. To run the project and see the output in the terminal window, type the‘ dotnet run’ command and press enter, and you will see the output.

Step 12: The second last icon on the left panel is Debug Panel. Once you click on that, you will see a green color button. This button is used to start debugging.

Sometimes, after clicking on debug button, it will ask you to install some auto configurations of the C# extension that we installed, so click on Yes in the prompt window as shown below.

Step 13: Once the debugging starts, you will see in the Debug panel that all the variables are visible in the watch window. And other types of windows are also updated with their respective feature that helps in debugging session.

To move to the next step, F10 and at runtime, the values of the variables will be updated once you step into the code.


So, this is how the debugging works in Visual Studio code. You can debug almost any type of application.
Finally, your project folder will look like the one below.


No comments yet