As a starting trader or investor, it’s essential to know the fundamentals of trade before trading. The market is already pretty volatile so it’s best to be prepared with the right knowledge, strategy and mindset!
But before you figure out your trading strategy and have a mindset ready for investing, you should start by knowing about the basics of trade, before anything else! This is an essential step all traders and investors should go through (if you want to become a great trader, at least).
One of the top topics you need to learn as a starting trader or investor is the fundamentals of technical analysis tools when trading. This is what helps you get an insight into the market’s trends, price movements and so on. All of which can help you better speculate and make better trading choices along the way.
So if you ever wonder how to trade forex the right way, then start by knowing the basics of trading! Below is everything that will help you understand technical analysis and its importance in forex trading:
-
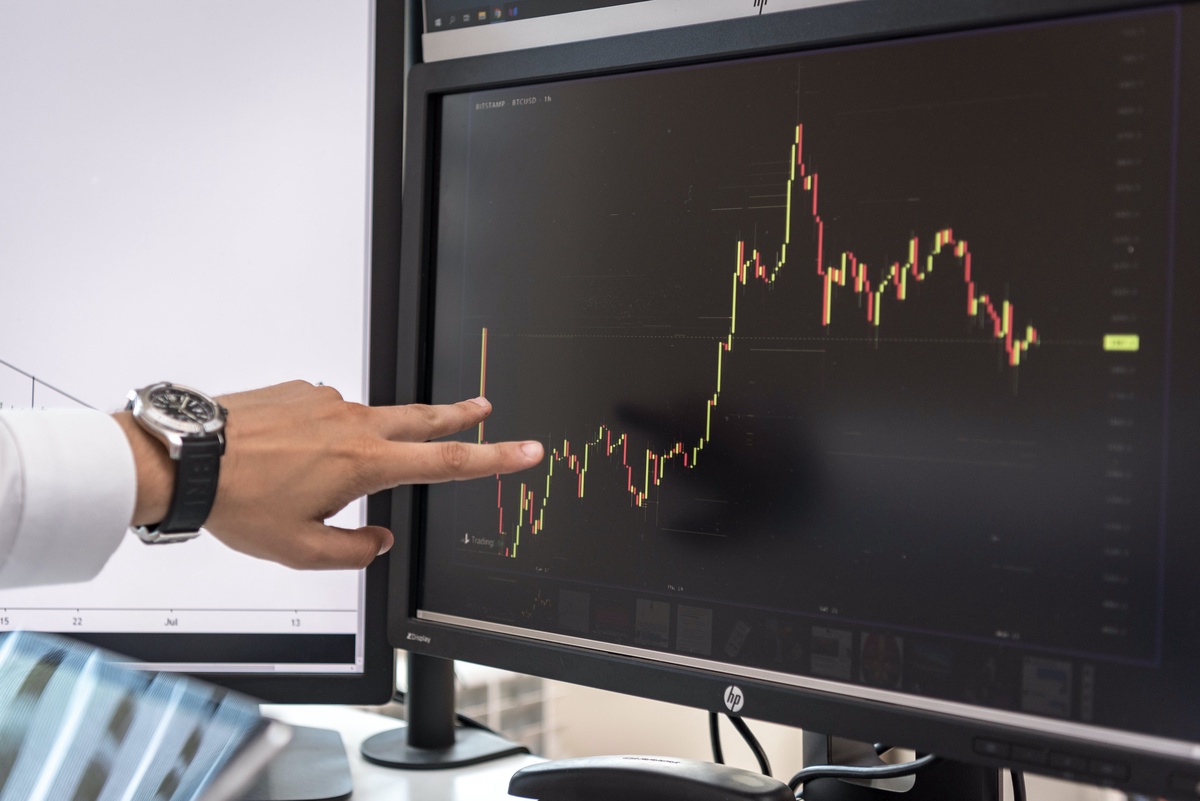
Charts!
With its ability to provide a variety of visual representations, including candlestick, line, and bar charts, charts are an essential tool for traders and investors. Thanks to the use of these many chart formats, traders may see complex price shifts and patterns over time. Which gives them the ability to identify trends and possible market orientations.
In the ever-changing world of financial markets, patterns such as the well-known head and shoulders, triangles, or flags require close observation to predict changes and guide strategic choices.
-
Indicators
There are a lot of advanced instruments used in market analysis! To give you an idea, it’s indicators like Moving Averages, Relative Strength Index (RSI), Moving Average Convergence Divergence (MACD) and Bollinger Bands. These instruments examine many facets of market dynamics, examining not only price trends but also subtleties such as volatility, momentum, and crucial overbought/oversold conditions.
-
Fibonacci Retracement
Based on the well-known Fibonacci sequence, the Fibonacci Retracement is a crucial instrument that traders use to interpret the complex levels of possible support and resistance in the financial markets. Making use of the built-in ratios from this series, the tool carefully examines retracements after price changes.
By comparing these retracements to the Fibonacci ratios, traders and investors can identify crucial levels that might provide strong support or resistance to the market action. Known for its extensive application and mathematical accuracy, this approach helps traders and investors formulate effective entry and exit positions as well as comprehend market dynamics.
-
Support and Resistance Levels
Support and Resistance Levels are cornerstones of market research that entail the difficult task of identifying past moments at which prices have regularly stopped, turned, or reversed. This crucial project provides traders with the foundational knowledge they need to make informed decisions about future price movements.
-
Chart Patterns
Visual depictions of market dynamics, or chart patterns, are an important component of trader analysis. Trading professionals who are adept at identifying and deciphering complex patterns like triangles, flags, double tops and bottoms, and wedges are better equipped to predict future price moves. These patterns reveal the underlying emotion of the market and suggest possible future movements, making them useful indicators for traders and investors alike.
-
Moving Advantages
Respected for their ability to smooth price data, moving averages are essential instruments that make it easier to recognise dominant market patterns. These adaptable indicators let traders see the deeper trend dynamics through a more focused lens by reducing the noise and volatility that come with price movements. In addition, the points at which two different moving averages cross, such as the popular 50-day and 200-day moving averages, are extremely important in the field of technical analysis.
-
Divergence Analysis
A complex subset of technical analysis is called divergence analysis. This compares price movements with well-known indicators like the Relative Strength Index (RSI) and the Moving Average Convergence Divergence (MACD).
By carefully examining the relationship between price movement and the signals produced by various indicators, this analytical method provides detailed insights into possible changes in market momentum. Traders and investors identify important but subtle signs of a possible market reversal.
This is done by closely examining the discrepancy between price patterns and the indicators produced by these advanced instruments.
-
Algorithmic and Automated Tools
Automated and Algorithmic Tools are essential instruments that many traders use to increase productivity and accuracy. These advanced systems use complicated algorithms and automated trading techniques that are carefully crafted to handle the intricacies of financial markets.
By utilising a variety of technical indicators and preset parameters, these instruments function flawlessly to carry out transactions with the best possible time and accuracy. They work in concert with an extensive array of technical indicators, formulating and carrying out trading choices with the help of indicators like Moving Averages, Relative Strength Index (RSI), and Moving Average Convergence Divergence (MACD), among others.

No comments yet