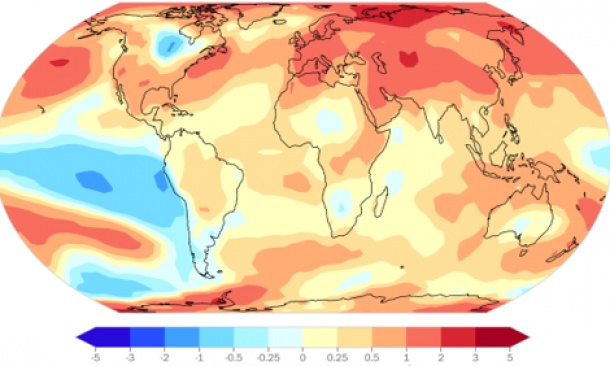
In the previous article, we delved into the world of weather APIs and introduced you to the Weatherstack API, a powerful tool for accessing real-time weather data. Today, in Part 2 of our series, we're taking it a step further. We'll explore how to utilize the Free Historical Weather Data API provided by Weatherstack to create an impressive weather dashboard that's both informative and engaging.
Understanding the Power of Historical Weather Data
Historical weather data holds immense value for a variety of applications. Whether you're a weather enthusiast, a data scientist, or a developer looking to integrate weather information into your project, historical weather data can provide crucial insights and context. With the Weatherstack API, accessing this treasure trove of information is not only easy but also free.
Getting Started with the Free Historical Weather Data API
- API Registration
To begin, you'll need to sign up for a free Weatherstack API account. Once registered, you'll receive an API key, which you'll use to make requests to the API.
- Making API Requests
With your API key in hand, you can start making requests to the Free Historical Weather Data API. You can specify a wide range of parameters, including location, date, and data points you want to retrieve. This flexibility allows you to tailor the data to your specific needs.
- Data Retrieval
The Weatherstack API responds with JSON data, making it easy to parse and integrate into your dashboard. You can access historical weather data for any location and date range, unlocking the ability to analyze trends and patterns.
Building Your Weather Dashboard
Now that you have access to historical weather data, it's time to create a weather dashboard that impresses you. Here are some key elements to consider:
- Data Visualization
Utilize charts, graphs, and maps to present historical weather data in an easily digestible format. Visualizations can help users quickly understand trends and patterns.
- User-Friendly Interface
Design an intuitive and user-friendly interface for your dashboard. Ensure that users can easily navigate and customize the information they want to see.
- Historical Insights
Highlight interesting historical weather events or trends in your dashboard. This can be a valuable addition for weather enthusiasts and researchers.
- Integration
Consider integrating other data sources or features, such as current weather information or location-based services, to enhance the overall utility of your dashboard.
Conclusion
Incorporating historical weather data into your weather dashboard can transform it from a basic tool into a valuable resource for users. With the Free Historical Weather Data API from Weatherstack, you have the means to unlock a wealth of information and create a truly exceptional weather dashboard.


No comments yet