Data visualization, often said to be worth a thousand words, empowers us to comprehend complex data swiftly and profoundly through the adept use of visual analytical tools.
In 2019, the data visualization market reached its pinnacle at USD 8.85 billion. According to a report by Fortune Business Insights, the market is projected to grow at a compound annual growth rate of 10.2%, reaching a value of USD 19.20 billion by 2027.
The global market of data visualizations and analytics is booming due to a few of the many factors listed below.
- Advancement of analytics and visualization tools
- Big complex data
- Increasing usage of smartphones and the internet
- Adoption of cloud computing
- Quick acceptance of Machine Learning (ML)
- Furtherance in the Internet of Things (IoT)
The benefits of the latest visual analytical tools include the depiction and interpretation of abundant complex data with comprehendible graphical representation, allowing non-technical users to understand valuable insights and hidden patterns in the data.
What is Data Visualization?
Data visualization refers to the graphical depiction of datasets, patterns, trends, and significant insights through graphs, charts, bars, or other visual formats, accomplished by utilizing analytics and visualization tools. These tools facilitate the efficient communication of relationships within various datasets.
Once data is collected, processed, and modeled, it becomes crucial for users to comprehend the gathered information. Data visualization serves as an effective means for employees or stakeholders to present data to non-technical audiences in a clear manner.
Data analytics and visualization tools enable us to delve beyond mere numbers and raw data. The versatility of data visualization is evident in its applications, spanning the creation of dashboards, annual reports, sales and marketing materials, investor presentations, and various other contexts where immediate interpretation of information is essential.
Keep reading and stay updated with the Latest Trends in Data Visualization with QeDatalabs insightful Blogs.
Top Data Visualization & Analytics Tools for Business Professionals
Why is Data Visualization Important?
Data analysts and researchers gather valuable information, but if clients and users can’t comprehend the data, it loses its value. Therefore, presenting data in user-friendly formats is crucial. Here are the advantages of using the latest visual analytics tools:
- Enhanced Clarity and Comprehension
- Improved Communication
- Facilitates Storytelling
- Reveals Patterns and Trends
- Aids Decision-Making
- Encourages Exploration and Discovery
- Supports Collaboration
- Speeds up Decision-Making Processes
- Increases Cost Efficiency
- Detects Errors
- Enhances Accessibility
- Simplifies Big Data Analysis
- Enables Predictive Analytics
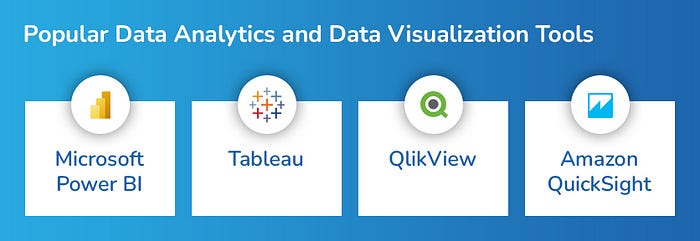
Popular Data Analytics and Data Visualization Tools
Here is a list of advanced data visualization tools that are gaining market recognition for their impressive performance and usability:

1) Microsoft Power BI
Microsoft Power BI stands as an impressive business intelligence tool, fostering collaboration and goal tracking within organizations. With its real-time analytics and trend analysis capabilities, users can make informed decisions confidently.
Seamlessly integrating with various Microsoft products and cloud services, Power BI emerges as a versatile solution for businesses.
Moreover, it prioritizes data security, ensuring the protection of user data. From building engaging dashboards to generating actionable reports, Power BI empowers users to drive impactful outcomes.
2) Tableau
Tableau, a dynamic analytics and visualization tool, empowers users to delve into data and disseminate findings effortlessly. With its versatility and robust features making data exploration accessible to all Tableau is one of the best visual analytics tools. With Tableau, creating visualizations is as simple as drag-and-drop, while leveraging AI-driven statistical modeling and natural language-infused QA enhances analytical capabilities.
This platform not only streamlines processes but also optimizes resources, leading to significant savings in time and costs across governance, security, compliance, maintenance, and support domains. Beyond being a mere analytics tool, Tableau equips users with the necessary expertise and assistance to drive scalability and success offering the benefits of the latest visual analytics tools.

3) QlikView
QlikView is a business intelligence (BI) platform for data analysis and visualization. Through its associative data model and in-memory processing capabilities, QlikView offers solutions across analytics, data integration, and data quality. QlikView utilizes an associative data model, which enables users to explore data relationships dynamically without the need for predefined queries making it one of the best visual analytics tools.
Through associative analysis, users can make selections and associations on the fly, allowing them to uncover hidden insights and patterns. QlikView offers a rich array of interactive visualizations, enabling users to create personalized dashboards and reports to visualize their data effectively. Collaboration and sharing features facilitate communication and decision-making across teams leveraging the benefits of the latest visual analytics tools.
4) Amazon QuickSight
Amazon QuickSight is a BI service provided by Amazon Web Services. It enables a smart data-driven decision-making process by creating and analyzing data visualizations. Amazon QuickSight facilitates extracting easy-to-understand insights and embedding interactive dashboards into multiple applications, portals, and websites.
Amazon QuickSight is a platform that provides simplified tools to build visualizations, perform ad-hoc analysis, and extract actionable insights from the data. Amazon QuickSight as a data analytics and visualization tool, enables exploring deeper insights in an interactive visual environment.
Widely Used Visualization Types
With data analytics and visualization tools, data can be represented using different types of visualization depending on the type and characteristics of data. The list below shows popular types of visualization used for data visualization:

- Chart
- Table
- Graph
- Geospatial
- Infographic
- Dashboards
- Box-and-whisker Plots
- Bullet Graph
- Area Map
- Histogram
- Pie Chart
- Treemap
Conclusion
Numerous data analytics and visualization tools abound in the market. Key considerations when choosing the optimal visual analytics tool include its ease of use and the breadth of features it provides. It’s crucial for a data visualization tool to effectively and simply communicate information to any user. This is precisely the expertise of QeDatalab’s data professionals. Our team employs advanced data visualization tools and best practices to ensure information is easily understandable for users of all technical backgrounds. Reach out to QeDatalab for top-tier data science consulting services and unlock the full potential of your data.


No comments yet