Introduction
In the realm of software development, quality assurance (QA) holds paramount importance. Ensuring that a product functions flawlessly across various platforms and scenarios demands meticulous testing. However, the effectiveness of testing efforts can only be truly gauged through insightful analysis of test data. This is where Test Analytics comes into play, providing invaluable insights into the quality and efficacy of your software.
Understanding the Significance of QA Dashboard
A QA Dashboard serves as the nerve center of your testing operations, offering a consolidated view of key metrics and performance indicators. It provides stakeholders with a real-time snapshot of the testing process, enabling informed decision-making and proactive intervention when necessary.
Incorporating a robust QA Dashboard into your testing infrastructure empowers teams to track progress, identify bottlenecks, and optimize testing strategies for enhanced efficiency and effectiveness. By leveraging advanced visualization techniques, such as charts, graphs, and heatmaps, QA Dashboards transform raw data into actionable insights, driving continuous improvement across the software development lifecycle.
Key Metrics to Monitor
When designing your QA Dashboard, it's essential to focus on metrics that provide meaningful insights into the quality and progress of your testing efforts. Here are some key metrics that should feature prominently:
Test Coverage
This metric measures the extent to which your test suite exercises the functionalities and features of your software. A comprehensive test coverage ensures that potential defects are identified and addressed before they impact end-users.
Defect Density
Defect density quantifies the number of defects discovered per unit of code or test case. Tracking this metric over time enables teams to assess the effectiveness of their testing processes and prioritize areas for improvement.
Test Execution Time
The time taken to execute test cases is a critical indicator of testing efficiency. By monitoring test execution time, teams can identify slow-running tests and optimize them for quicker feedback loops.
Harnessing the Power of Test Reporting Tools
In conjunction with a QA Dashboard, leveraging a robust test reporting tool enhances the visibility and accessibility of test data. These tools enable teams to generate comprehensive reports that can be shared with stakeholders, facilitating transparency and collaboration across the organization.
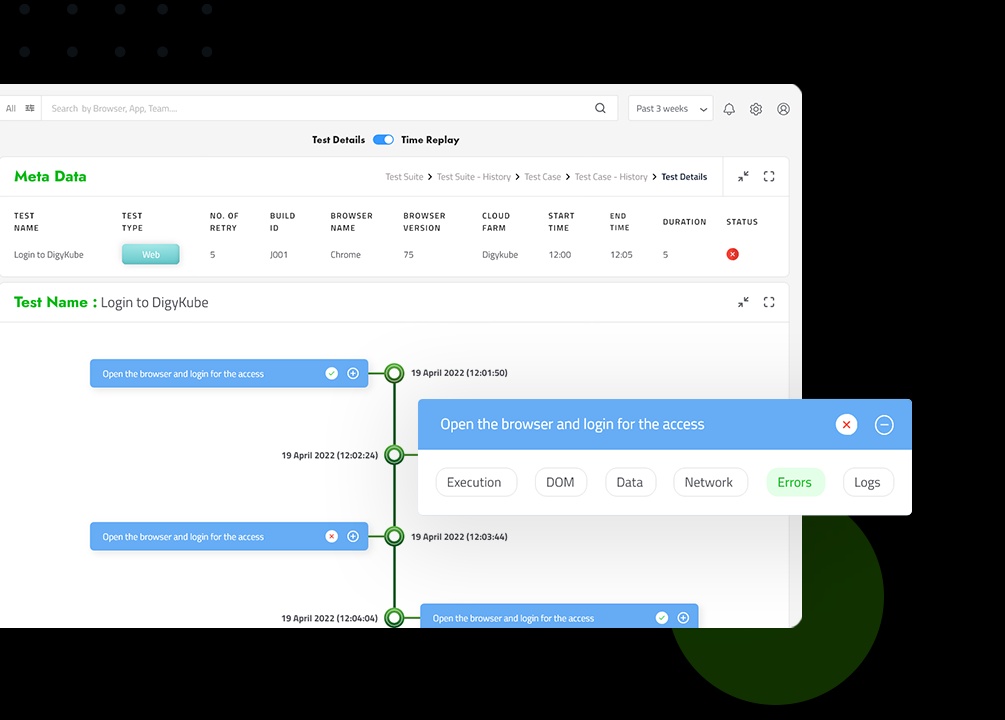
One such exemplary test reporting tool is Digy4, renowned for its versatility and analytical capabilities. Digy4 seamlessly integrates with existing testing frameworks, collecting and aggregating test data from various sources into cohesive reports. Its intuitive interface and customizable dashboards empower teams to tailor reports according to their specific requirements, ensuring relevance and clarity.
The Role of QA Dashboard in Continuous Improvement
Continuous improvement lies at the heart of effective QA practices, and a well-crafted QA Dashboard serves as a catalyst for this ongoing process. By regularly reviewing and analyzing key metrics, teams can identify trends, patterns, and areas for optimization, driving iterative enhancements to their testing methodologies.
Moreover, QA Dashboards facilitate data-driven decision-making, enabling teams to prioritize tasks, allocate resources efficiently, and mitigate risks effectively. Whether it's adjusting test coverage based on emerging trends or fine-tuning testing strategies in response to changing requirements, QA Dashboards provide the insights needed to steer testing efforts in the right direction.
Conclusion
In conclusion, Test Analytics, powered by robust QA Dashboards and test reporting tool like Digy4, revolutionizes the way we approach software testing. By focusing on key metrics, such as test coverage, defect density, and test execution time, organizations can gain invaluable insights into the quality and efficacy of their testing efforts.
Embracing a culture of continuous improvement, facilitated by data-driven decision-making, enables teams to deliver high-quality software that meets the evolving needs of users. As technology continues to advance and software development becomes increasingly complex, investing in Test Analytics becomes not just a choice but a necessity for organizations striving to stay ahead in today's competitive landscape.

No comments yet