candlestick chart
(1)
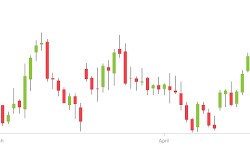
What is candlestick chart
Candlestick or candlestick chart is a type of financial price chart used to describe the high, low, open, and close prices of an asset over a specific period of time. Key details Candlestick or Japanese candlestick charts display four important p...
wasim tariq · 23 February 2023 · 24