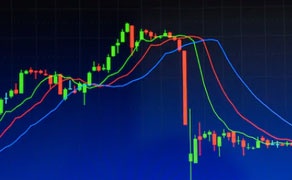
Correct technical analysis is crucial for your trading outcome since it allows you to predict future price movements and make rational decisions on the market. Support and resistance are among the most important concepts of technical analysis: they refer to key price levels at which the price of an asset is expected to stop rising or falling. These levels can be very useful for your trading strategy, so now we are going to discuss which indicator is the best for defining them.
Support and resistance
Basically, support refers to a price level that can stop or reverse the current downward trend. On this level, the demand for a certain asset is considered high enough to prevent the price from falling even further down. Resistance is the contrary concept: on this level, the supply of an asset is high enough to prevent the price from going further up. These levels are flexible and can help you get signals for buying or selling, depending on the trading strategy you’re using.
Useful indicators
Defining support and resistance levels is very important, so there are numerous indicators that allow you to do that. For example, many traders use trend lines or moving averages. However, it is always better to have one simple indicator, especially when you’re just a beginner and don’t have experience that’s necessary to compare and combine different charts. In this case, the S&R indicator seems like truly the best indicator for support and resistance spotting.
How S&R works
MetaTrader 4 is arguably the most common trading platform on the market, and it has several built-in indicators to define support and resistance levels. The S&R indicator is a custom one: it can be useful for finding the closest support and resistance zones for a given chart. It works pretty well even on the default settings, but you can also customize it to make it suitable for your needs. The most important advantage of this indicator is that it works on every timeframe and with all assets.
Applying the indicator is pretty easy: just import it to your MT4 and run it from the main indicator menu to use it on your price chart. However, you should be aware that even this indicator is not precise, so it is very important to apply other analytical methods: for example, fundamental analysis. You can check out whether these automatically defined levels are close to the previous highs and lows as well.


No comments yet