Support and resistance levels are by far the two most commonly used concepts in market analysis. Support and resistance levels are used both in classical technical analysis and in progressive directions — analysis of clusters, deltas, profiles.
In this article we will explain not only the classical side of support and resistance levels, but also show the methods of their construction based on the volumes analysis.
Support and resistance levels
Support and resistance levels in classical psychoanalysis are a part of chart pattern analysis. These concepts are used by traders to refer to price levels on charts, which generally act as barriers preventing price from moving in a certain direction.
Support and resistance levels are usually built from price extremes. This sounds straightforward, but as you "dive into the charts" you are likely to discover that support and resistance can take many forms. Extremes are many. Do all count as support and resistance levels? Subjectivity will contribute, and it turns out that finding support and resistance is not as straightforward as it first appears. Support is the price level at which a downtrend can be expected to stop due to a concentration of demand. Correspondingly, resistance is the price level at which an upward trend can be expected to stop due to a concentration of supply. To indicate support and resistance we advise to use specified indicators.
The support/resistance line is said to be of greater value the more times the price has failed to move beyond it.
Finding trades near support and resistance
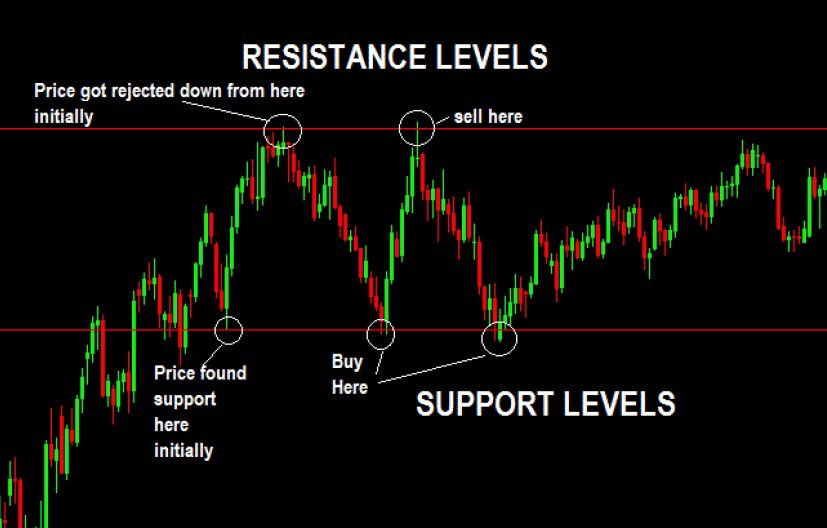
Once lines, or zones of support or resistance, are identified, they provide valuable potential entry or exit points.
When price reaches a support or resistance point, it does one of three things:
- Bounces off the support/resistance level.
- Breaks through the level and continues in its direction until it reaches the next significant support/resistance level.
- Makes a false-break (trap).
We wrote about these three layouts in our article on trading strategies.
Typically, traders open trades on the belief that the support and resistance zones will not be breached and a reversal will occur. But this scenario is not guaranteed.
Indicators for finding support and resistance
But the market profile is not the only option. Horizontal support and resistance levels can also be found
- using Stacked Imbalance, Big Trades, Speed of Tape indicators;
- using Maximum Levels, Dynamic Levels indicators;
- using an indicator DOM Levels;
- using a Margin Levels indicator.
Also take a look at our video on finding support and resistance levels.
All the links above lead to articles describing the techniques for finding support and resistance levels with the volumetric analysis indicators. Use professional tools to look for price reversals where few would expect.

No comments yet